Data sets
For the purpose of this book some built-in data sets are used. Most of the built in data sets are available via rapaio.datasets.Datasets class. This is an utility class which provides some standard data sets used in many statistical and machine learning text books. There are a few which we will use for the purpose of this tutorial.
Iris data set
The Iris flower data set or Fisher's Iris data set is a multivariate data set introduced by Ronald Fisher in his 1936 paper The use of multiple measurements in taxonomic problems as an example of linear discriminant analysis. It is sometimes called Anderson's Iris data set because Edgar Anderson collected the data to quantify the morphological variation of Iris flowers of three related species.
Two of the three species were collected in the Gaspé Peninsula all from the same pasture, and picked on the same day and measured at the same time by the same person with the same apparatus.
The data set consists of 50 samples from each of three species of Iris (Iris setosa, Iris virginica and Iris versicolor). There are for measures for each sample: the length and the width of the sepals and petals, in centimeters. Based on the combination of these four features, Fisher developed a linear discriminant model to distinguish the species from each other.
Frame iris = Datasets.loadIrisDataset();
iris.printSummary();
This is the summary of this data set:
Frame Summary
=============
* rowCount: 150
* complete: 150/150
* varCount: 5
* varNames:

 0. sepal-length : num | 2. petal-length : num | 4. class : nom |
 1.  sepal-width : num | 3.  petal-width : num |

   sepal-length      sepal-width     petal-length      petal-width            class
   Min. : 4.300     Min. : 2.000     Min. : 1.000     Min. : 0.100      setosa : 50
1st Qu. : 5.100  1st Qu. : 2.800  1st Qu. : 1.600  1st Qu. : 0.300  versicolor : 50
 Median : 5.800   Median : 3.000   Median : 4.350   Median : 1.300   virginica : 50
   Mean : 5.843     Mean : 3.057     Mean : 3.758     Mean : 1.199
2nd Qu. : 6.400  2nd Qu. : 3.300  2nd Qu. : 5.100  2nd Qu. : 1.800
   Max. : 7.900     Max. : 4.400     Max. : 6.900     Max. : 2.500
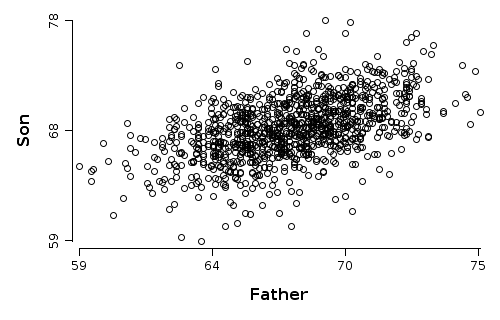
Pearson's Height Data
This simple data set comes from a famous experiment by Karl Pearson around 1903. The number of cases is 1078. The original data values were rounded to produce heights to the nearest inch.
Frame fs = Datasets.loadPearsonHeightDataset();
fs.printSummary();
The summary of the data set shows the two numeric variables with heights for fathers and sons.
Frame Summary
=============
* rowCount: 1078
* complete: 1078/1078
* varCount: 2
* varNames:

 0. Father : num | 1. Son : num |

          Father               Son
   Min. : 59.000     Min. : 58.500
1st Qu. : 65.800  1st Qu. : 66.900
 Median : 67.800   Median : 68.600
   Mean : 67.687     Mean : 68.684
2nd Qu. : 69.600  2nd Qu. : 70.500
   Max. : 75.400     Max. : 78.400