Build a majority model
To make a first submission we will build a very simple model, which classifies with a single value all instances. This value is the majority label.
Let's inspect at how target variable look like.
DVector.newFromCount(false, train.getVar("Survived")).printSummary();
        0       1
        -       -
  549.000 342.000
As we already new from the summary, the number of passengers who didn't survived is lower than those who did. Let's see percentages:
DVector.newFromCount(false, train.getVar("Survived")).normalize().printSummary();
      0     1
      -     -
  0.616 0.384
We note that there are about of passengers who did not survived. We will create a submit data set, which we will save for later submission. How we can do that?
Nominal prediction = Nominal.from(test.rowCount(), row -> "0").withName("Survived");
Frame submit = SolidFrame.wrapOf(test.var("PassengerId"), prediction);

new Csv().withQuotes(false).write(submit, root + "majority_submit.csv");
In the first line we created a new nominal variable. The size of the new variable is the number of rows from the test frame. For each row we produce the same label "0". We name this variable Survived.
In the second line we created a new frame taking the variable named PassengerId from the test data set and the new prediction variable.
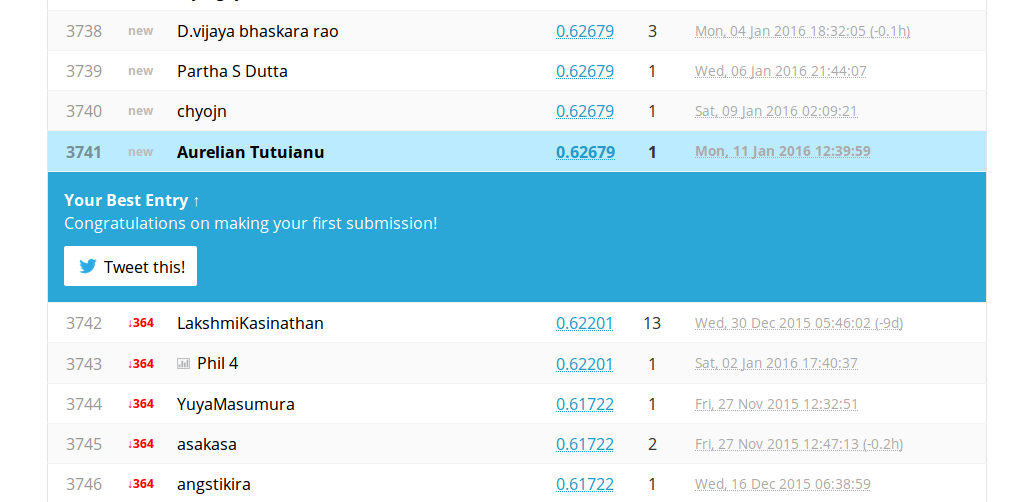
In the last line we wrote a new csv file with the csv parsing utility, taking care to not write quotes. We can submit this file and see which are the results.

Build a simple gender model
It has been said that "women and children first" really happened during Titanic tragedy. If this was true or not, we do not know. But we can use data to see if we are hearing the same story. For now we will take the gender and see if it had an influence. We will build a contingency table for variables Sex and Survived.
DTable.newFromCounts(train.getVar("Sex"), train.getVar("Survived"), false).printSummary();
              0       1   total
   male 468.000 109.000 577.000
 female  81.000 233.000 314.000
  total 549.000 342.000 891.000
On rows we have levels of Sex variable. On columns we have levels of Sex variable. Cells are computed as counts. What we see is that there are a lot of men who did not survived and a lot of women who does. We will normalize on rows to take a closer look.
DTable.newFromCounts(train.var("Sex"), train.var("Survived"), false)
  .normalizeOnRows().printSummary();
            0     1 total
   male 0.811 0.189 1.000
 female 0.258 0.742 1.000
  total 1.069 0.931 2.000
It seems that men survived with a rate of and women with . The values are so obvious, we need no hypothesis testing to check that this variable is significant for classification. We will build a simple model where we predict as survived all the women and not survived all the men.
Var prediction = NominalVar.from(test.rowCount(),
        row -> test.getLabel(row, "Sex").equals("male") ? "0" : "1")
        .withName("Survived");
Frame submit = SolidFrame.wrapOf(test.var("PassengerId"), prediction);
new Csv().withQuotes(false).write(submit, root + "gender_submit.csv");
