Points (XY Scatter plot)
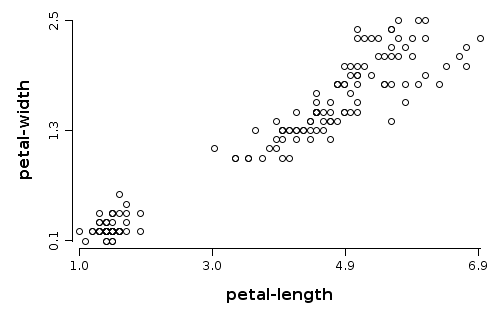
We can study the relation between two numerical variables by drawing one point for each instance.
Example 1
Scope: Study which is the relation between petal-length and sepal-length from iris data set.
Solution:
WS.draw(points(iris.getVar("petal-length"), iris.getVar("petal-width")));
iris.var("petal-length")- variable used to define horizontal axisiris.var("petal-width")- variable used to define vertical axis
Example 2
Scope: Study which is the relation between petal-length and sepal-length from iris data set. Color each point with a different color corresponding with value from variable class and add a legend for colors.
Solution:
WS.draw(points(iris.getVar("petal-length"), iris.getVar("petal-width"),
    color(iris.var("class")), pch(2))
        .legend(1.5, 2.2, labels("setosa", "versicolor", "virginica"));
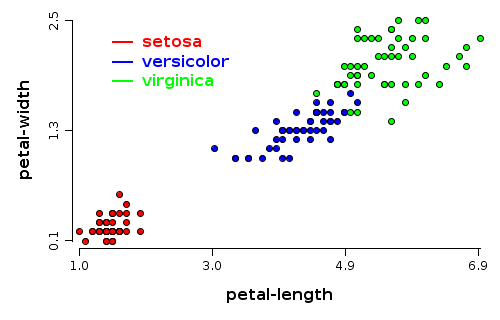
iris.getVar("petal-length")- variable used to define horizontal axisiris.getVar("petal-width")- variable used to define vertical axiscolor(iris.getVar("class"))- nominal variable which provides indexes to select colors from current palettepch(2)- select the type of figure used to draw points (in this case is a circle filled with solid color and a black border)legend(1.5, 2.2, labels("setosa", "versicolor", "virginica"))- adds a legend at the specific position specified in the data range; labels are specified by parameter, colors are taken as default from current palette starting with 1