Density line
A density line is a graphical representation of the distribution of a continuous variable. The density line is similar with a histogram in purpose but it has a different strategy to build the estimate. The density line plot component implements a kernel density estimator which is basically a non-parametric smoothing method, named also Parzen-Rosenblatt window method.
There are two main parameters for a density line: bandwidth and base density kernel function. The default bandwidth is computed according with Silverman's rule of thumb (more details on Wikipedia kernel density page). The default kernel function is the Gaussian pdf.
Kernel function estimators can be constructed using various kernel functions like Gaussian, uniform, triangular, Epanechnikov, cosine, tricube, triweight, biweight. All of them are available in rapaio library and also some custom can be built.
Example 1
Scope: Illustrate the process of building the KDE estimation
Solution:
// this is our sample
NumericVar x = NumericVar.wrap(-2.1, -1.3, -0.4, 1.9, 5.1, 6.2);

// declare a bandwidth for smoothing
double bw = 1.25;

// build a density line
Plot p = densityLine(x, bw);

// for each point draw a normal distribution
x.stream().forEach(s -> p.funLine(xi ->
    new Normal(s.value(), bw).pdf(xi) / x.rowCount(),
    color(1)));
WS.draw(p);
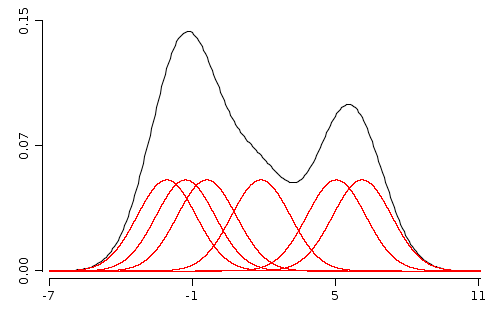
With red are depicted the kernel functions used to spread probability around sample points. With black is depicted the kernel density estimation which is the sum of all individual kernel functions.
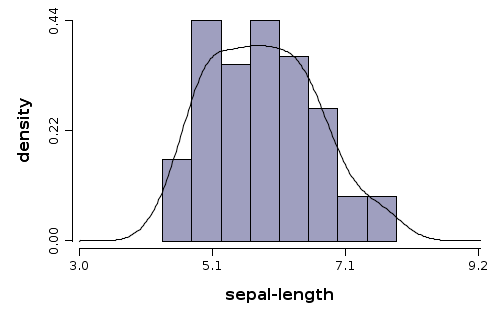
Example 2
Scope: Estimate density of iris sepal-length variable by histogram and density function
Solution:
WS.draw(hist(iris.getVar("sepal-length"), prob(true))
    .densityLine(iris.getVar("sepal-length")));
hist(..)- builds a histogramiris.getVar("sepal-length")- variable used to build histogram and also to build the density lineprob(true)- parameter which specifies to a histogram to use probabilities (approximated by frequency ratios)densityLine(..)- builds a density line
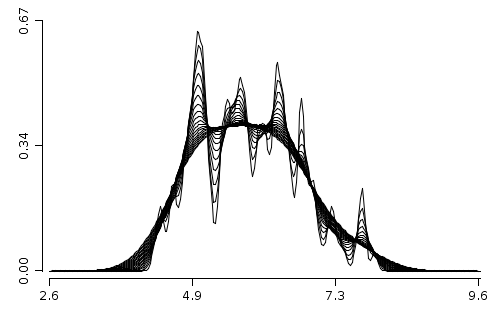
Example 3
Scope: Build multiple kernel density estimates for various bandwidth values
Solution:
Plot p2 = plot();
DoubleStream.iterate(0.05, xi -> xi + 0.02)
    .limit(20)
    .forEach(v -> p2.densityLine(iris.getVar("sepal-length"), v));
WS.draw(p2);